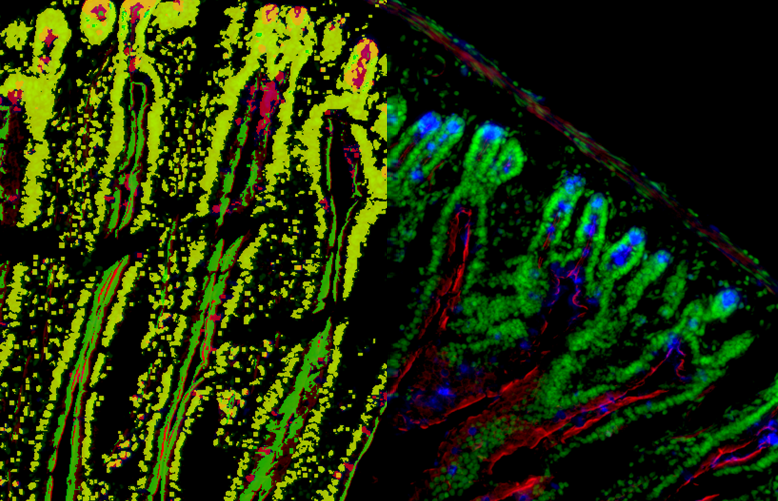
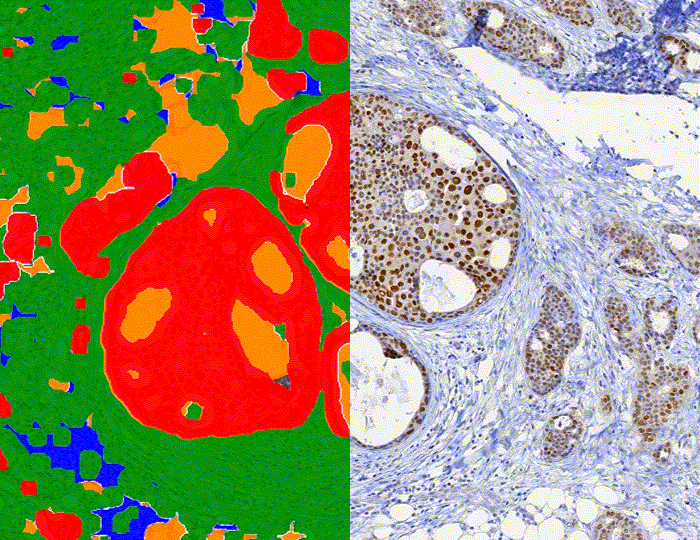
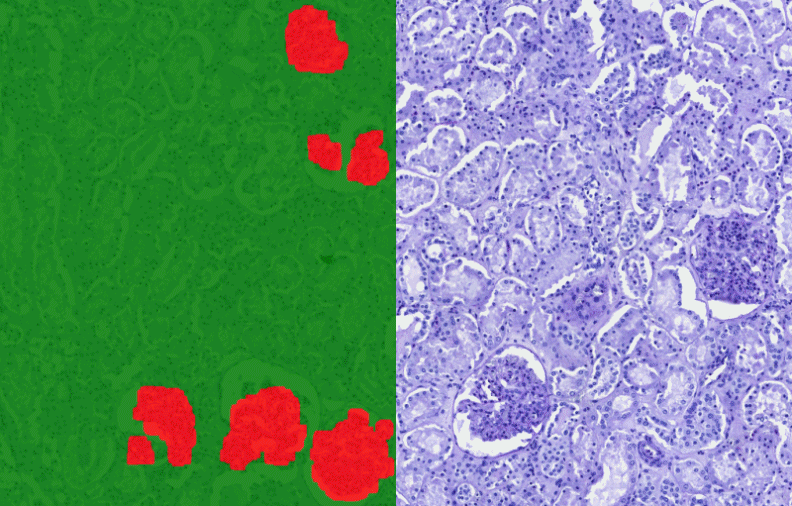
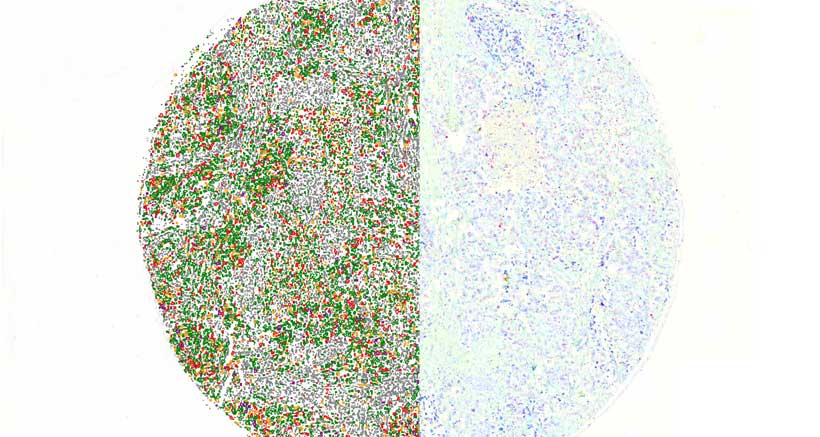
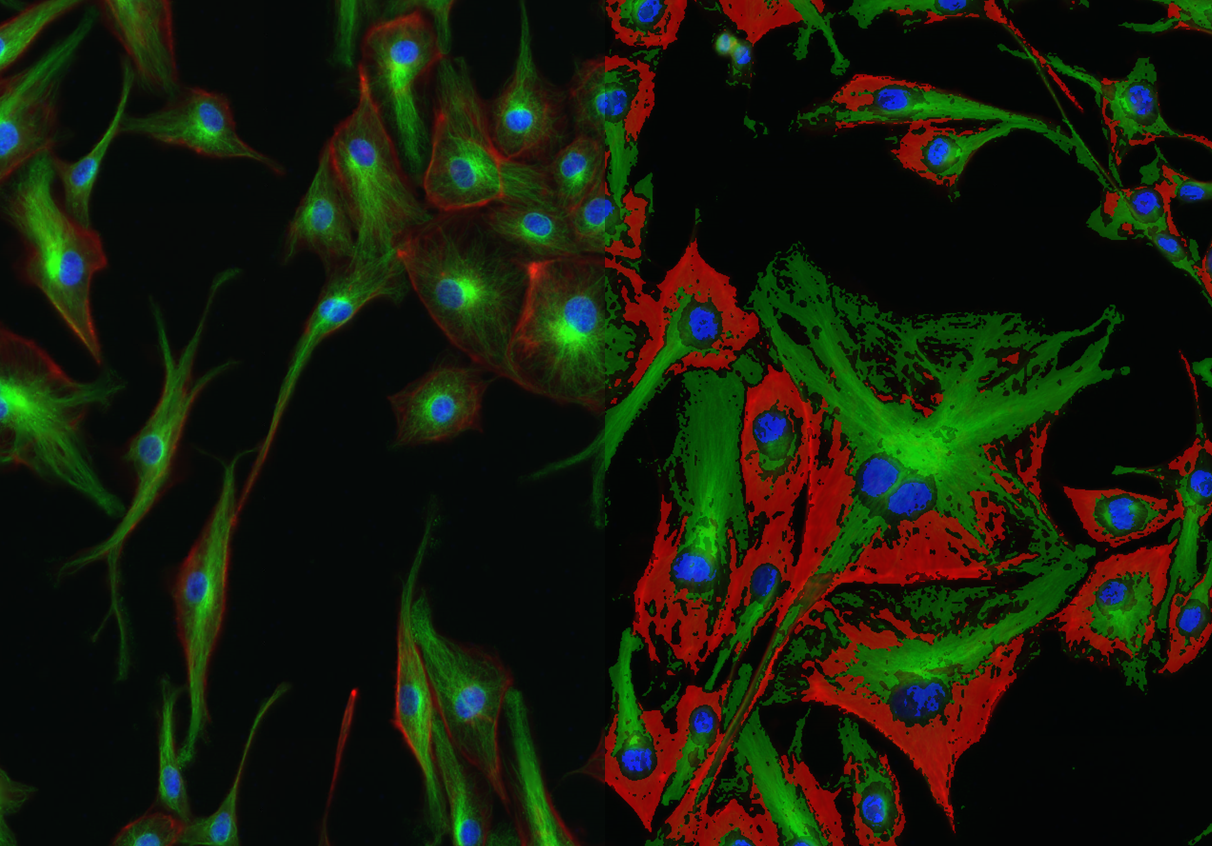
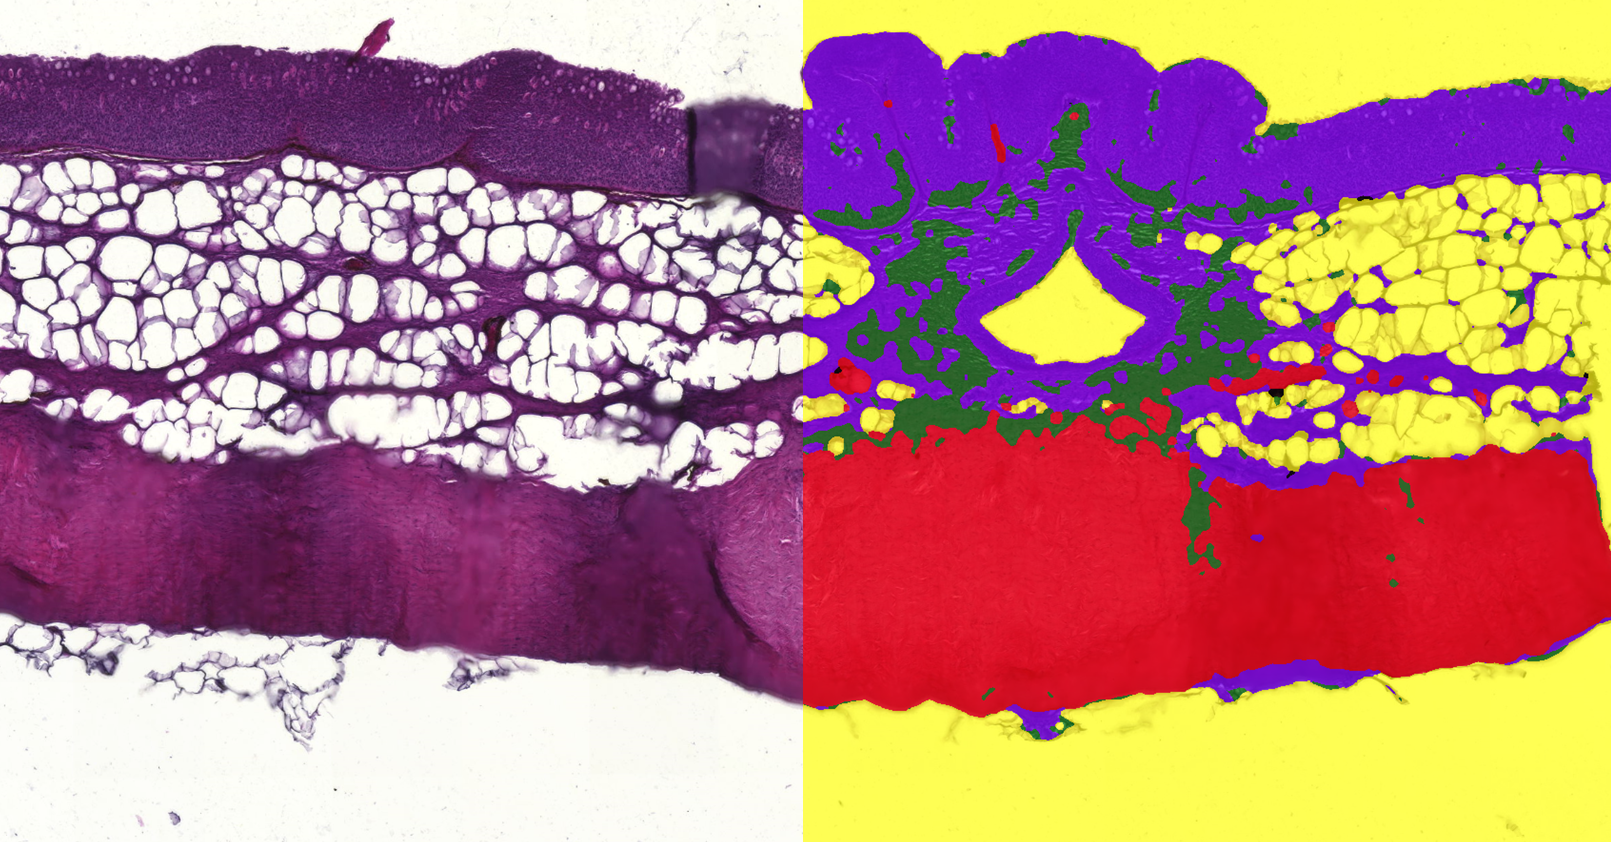
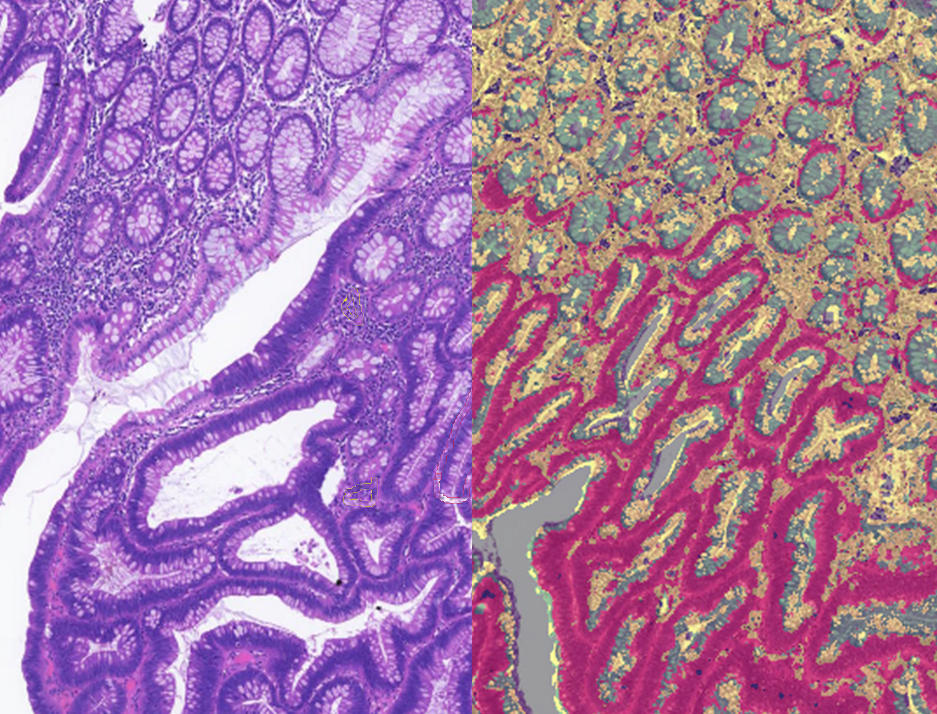
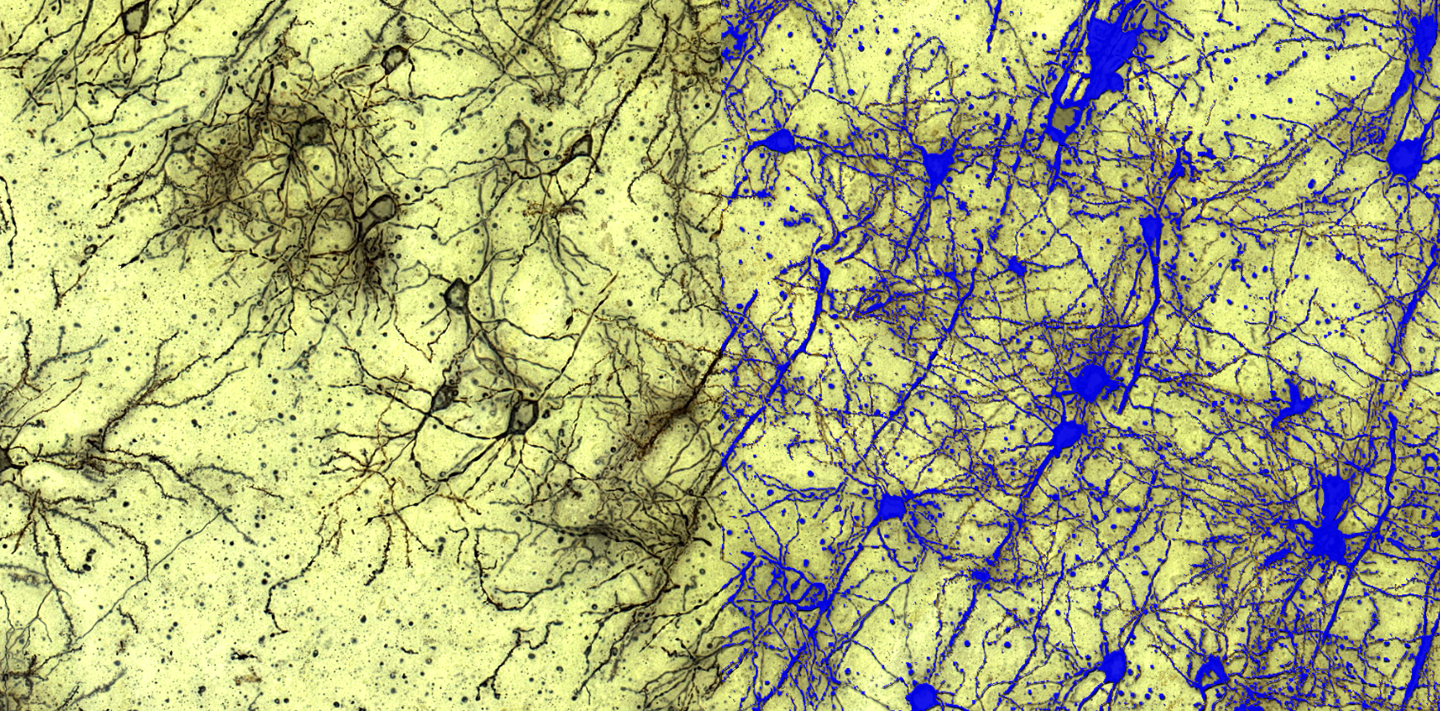
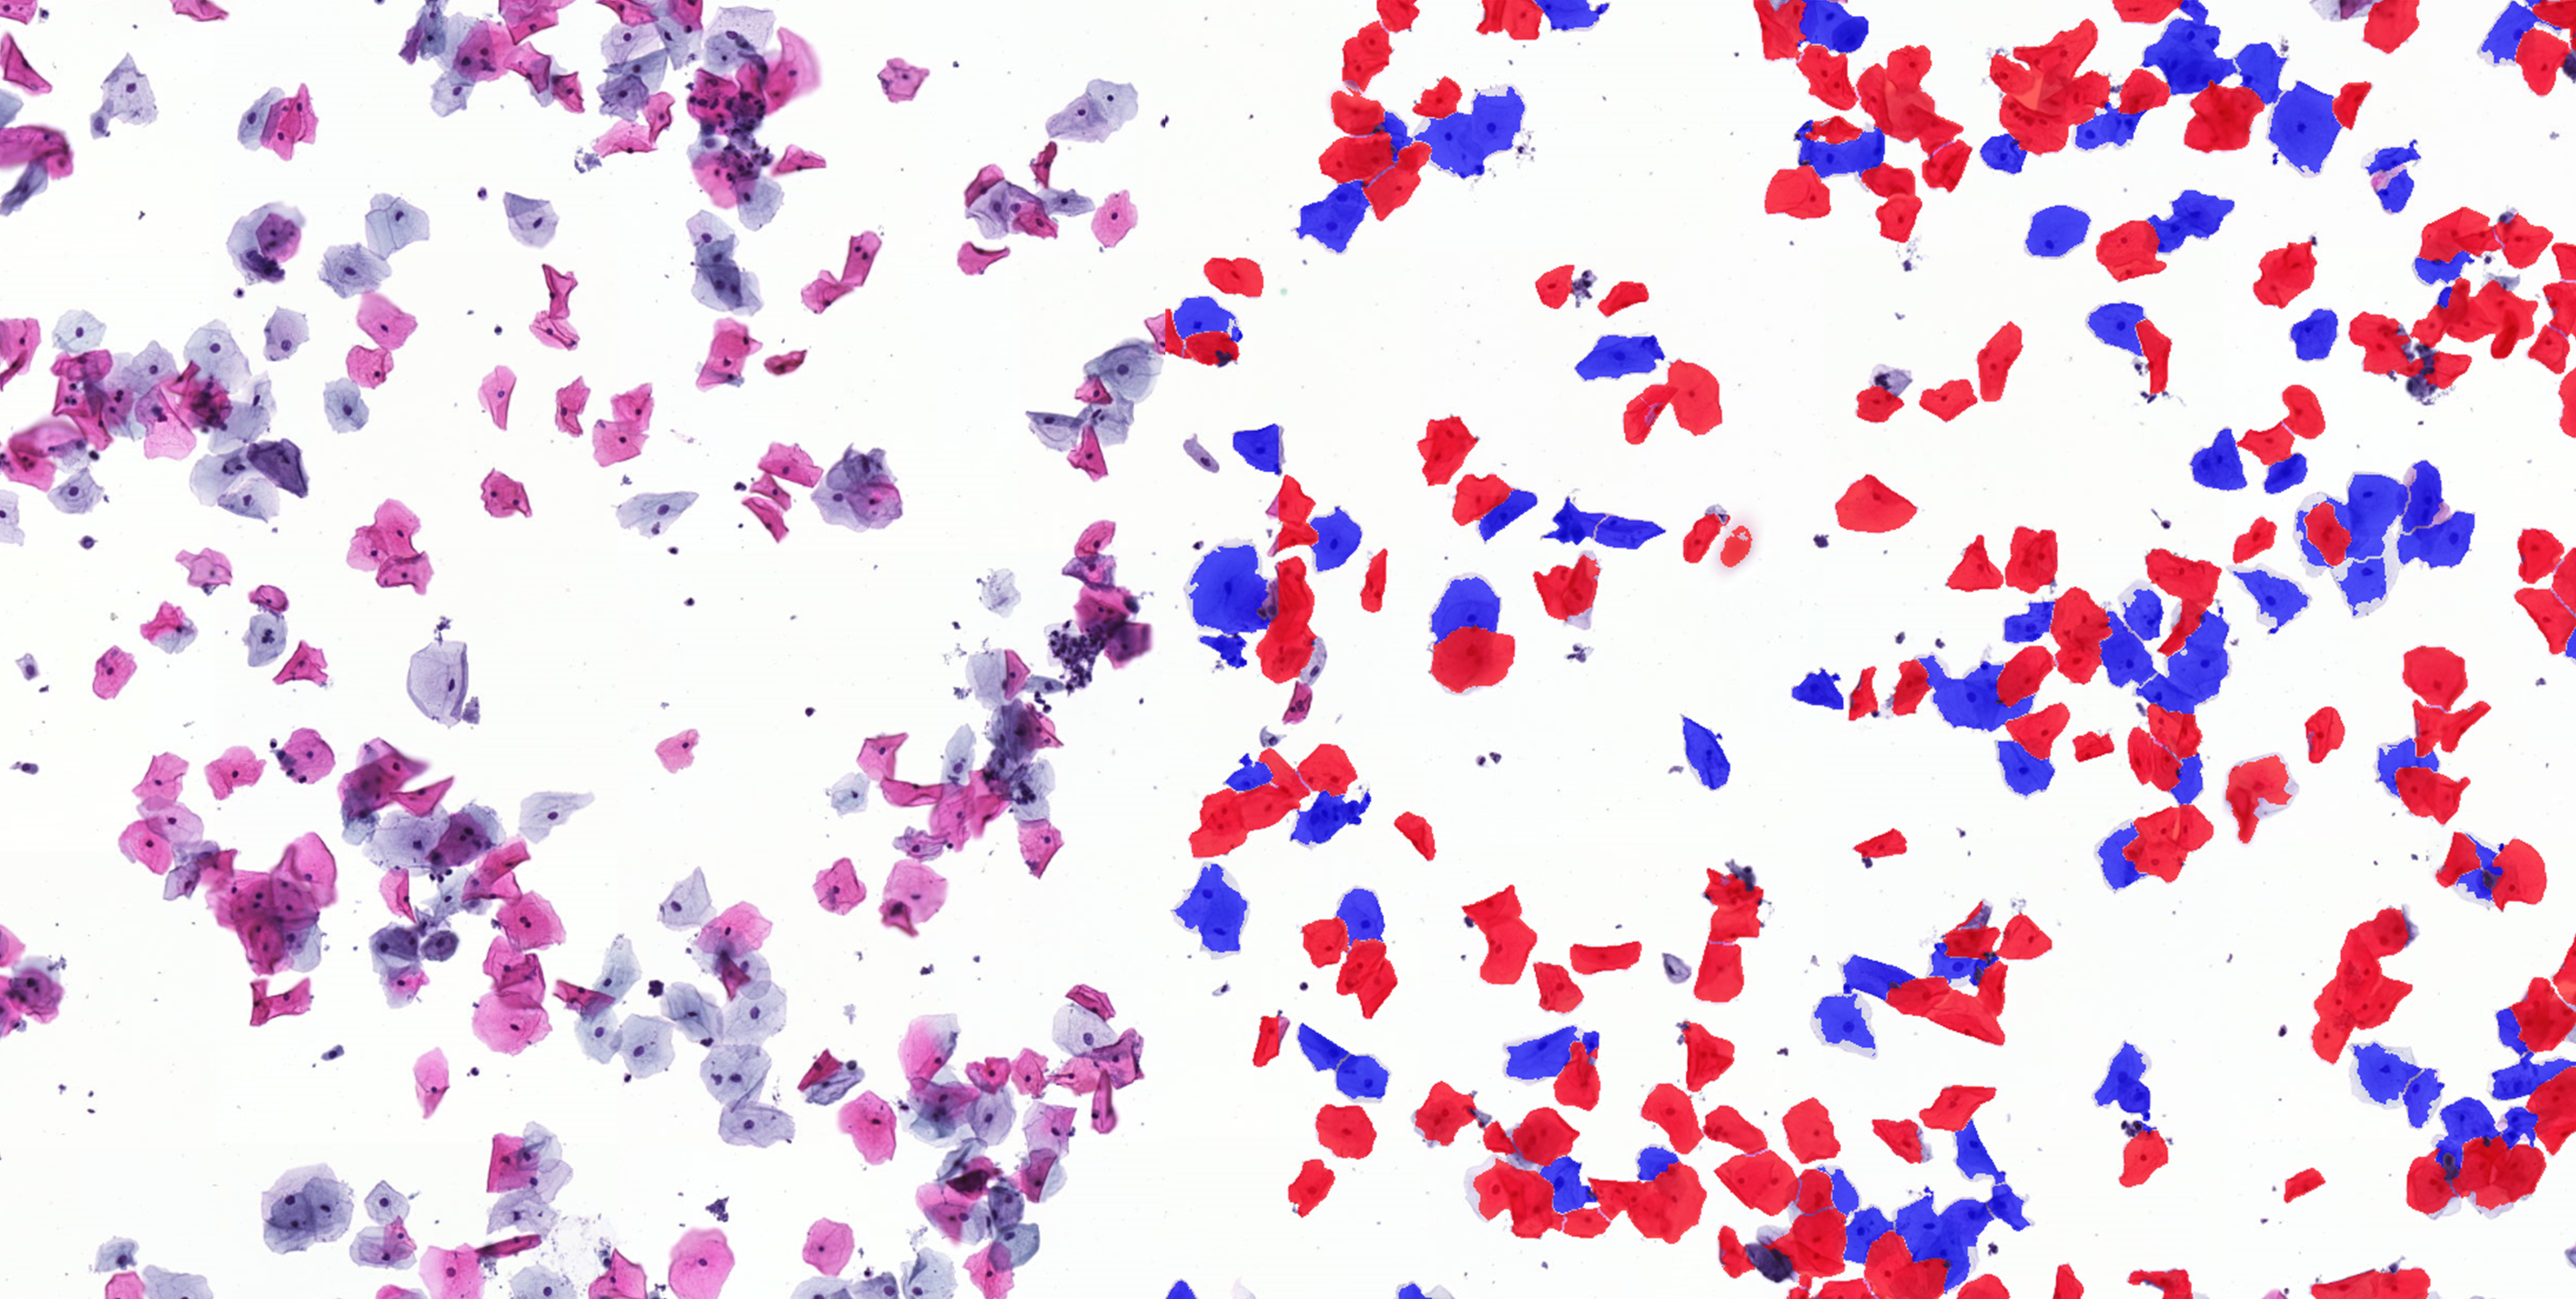
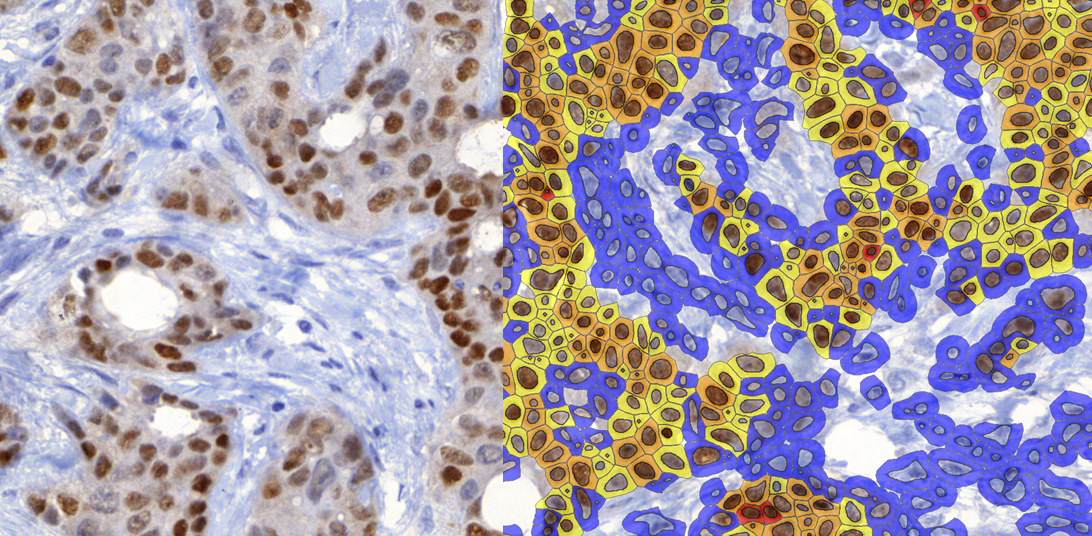
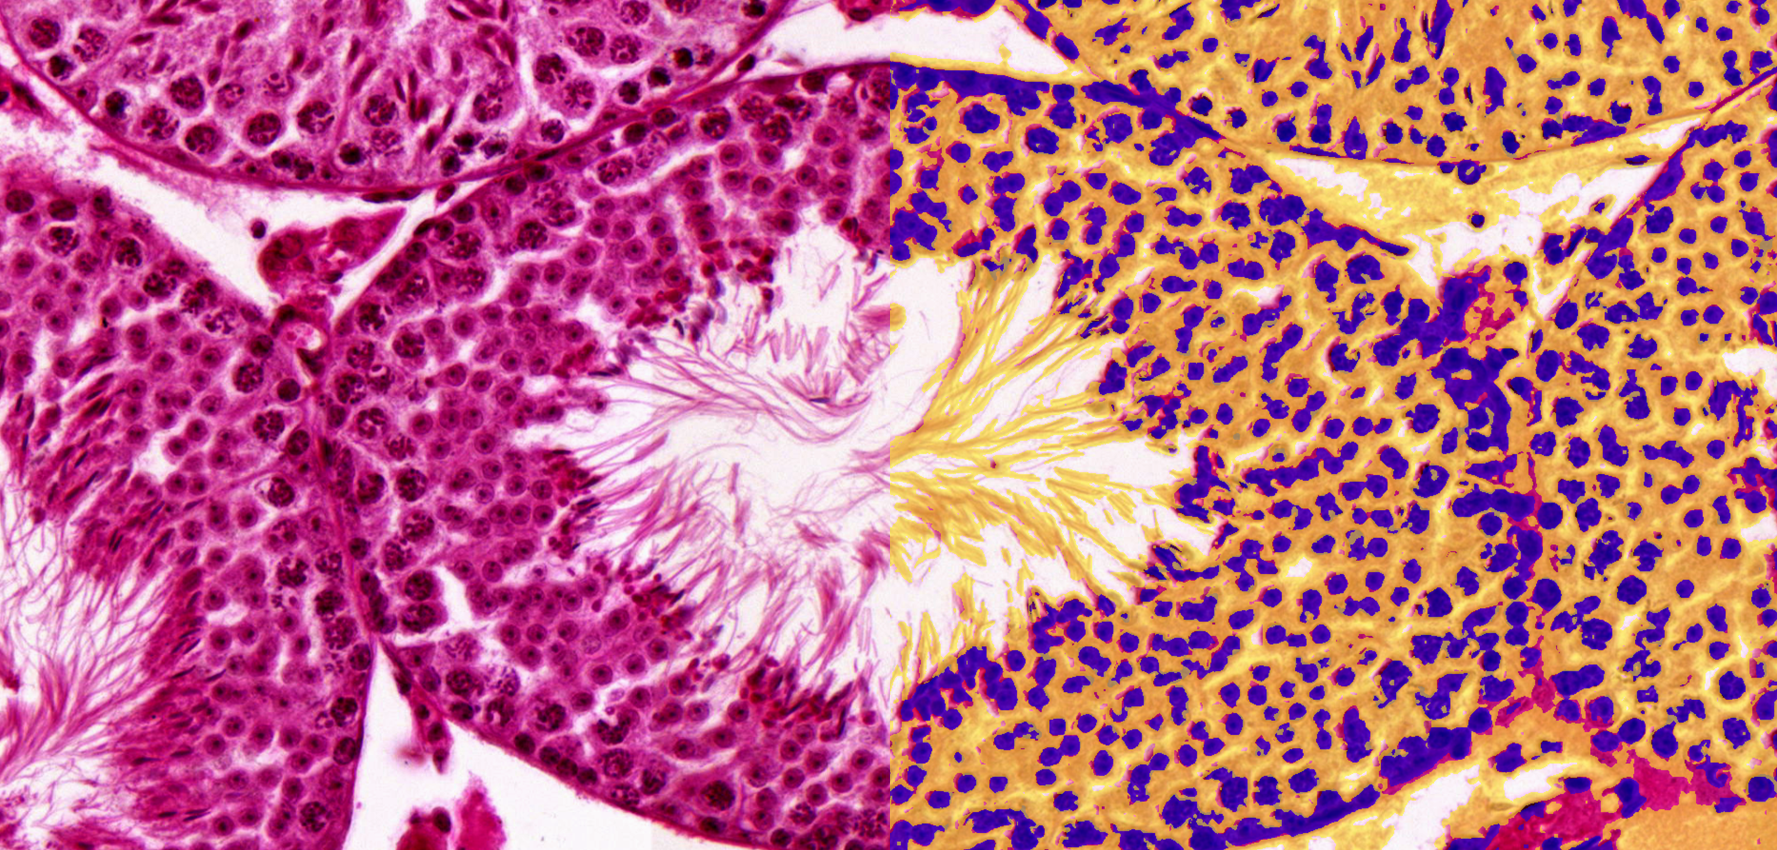
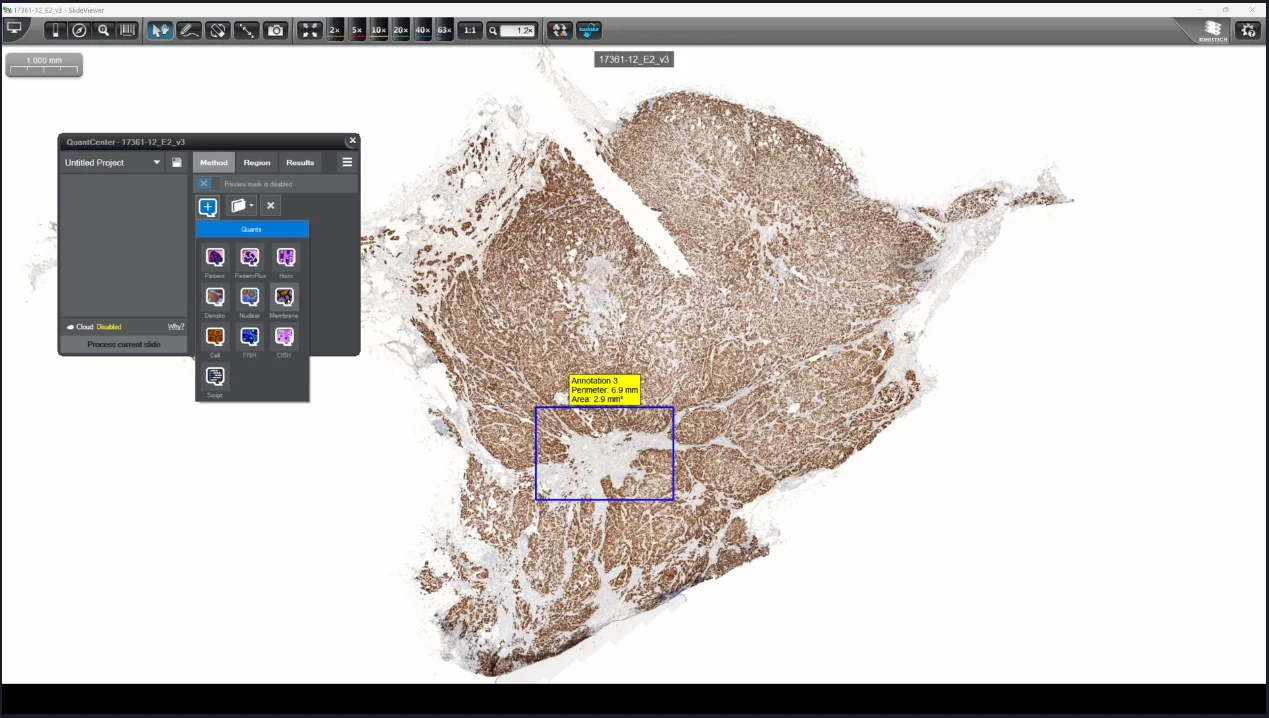
Advanced segmentation and classification tools, including HistoQuant, PatternQuant, and PatternQuant Plus, ensure accurate stain identification and deep-learning-driven tissue recognition.
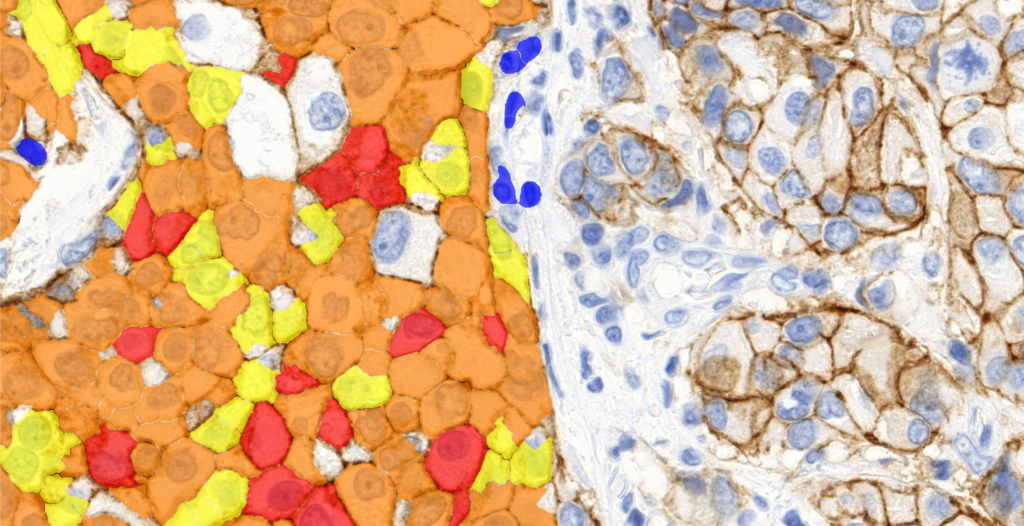
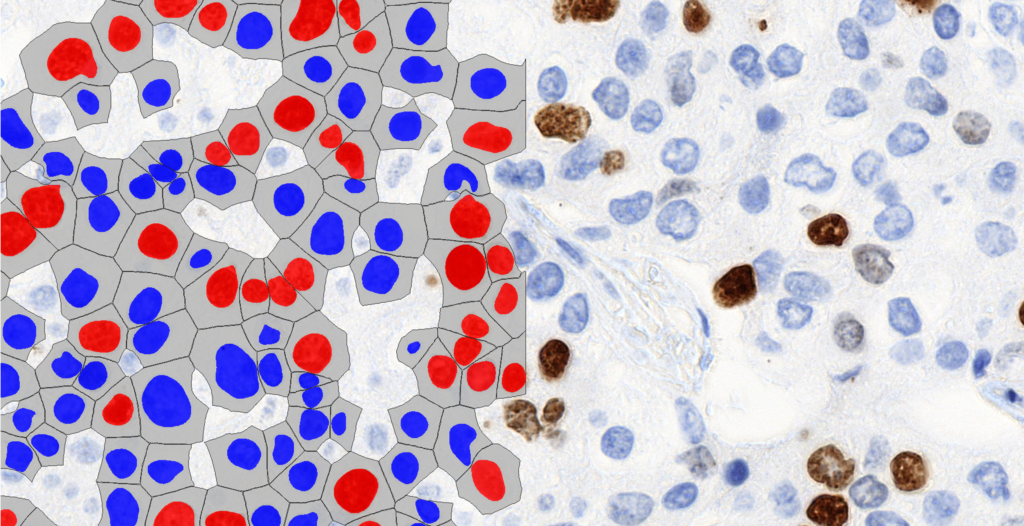
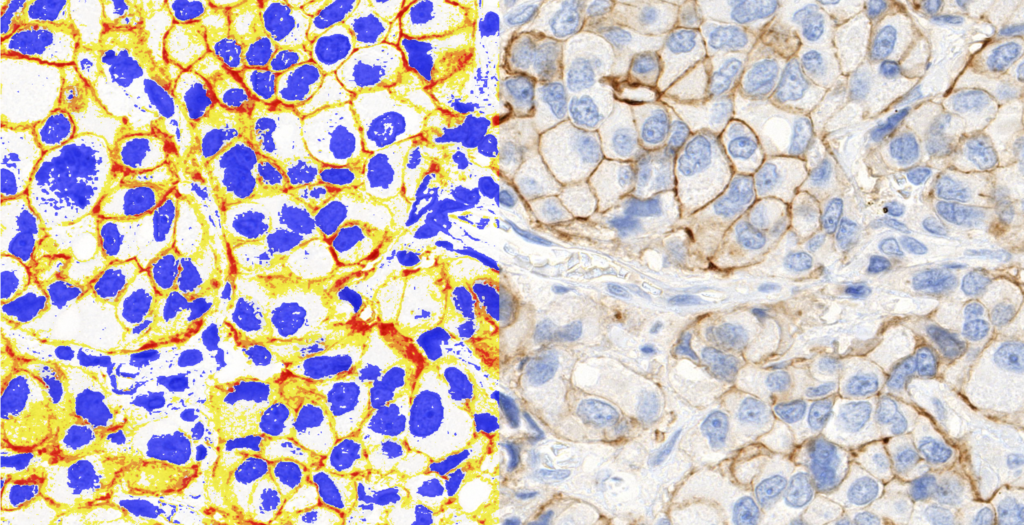
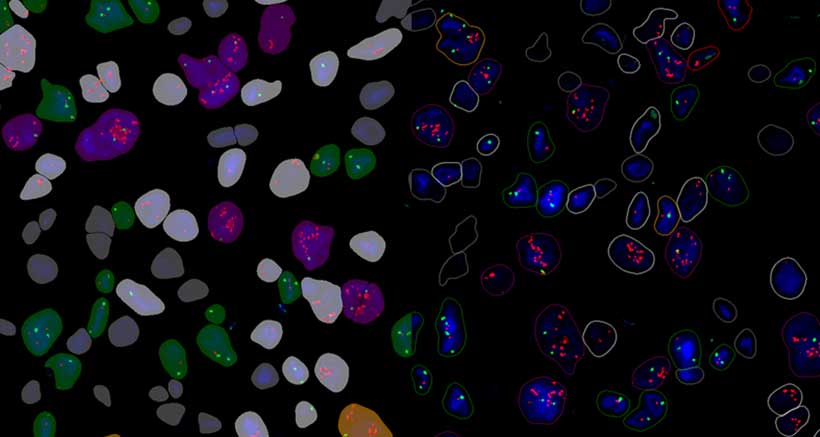
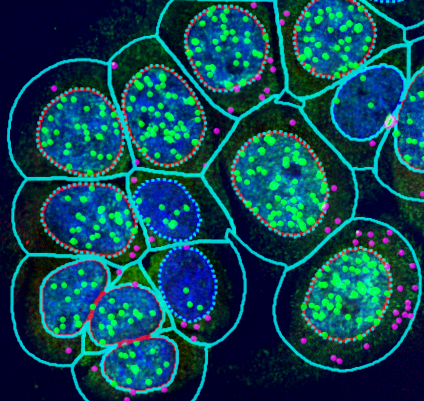
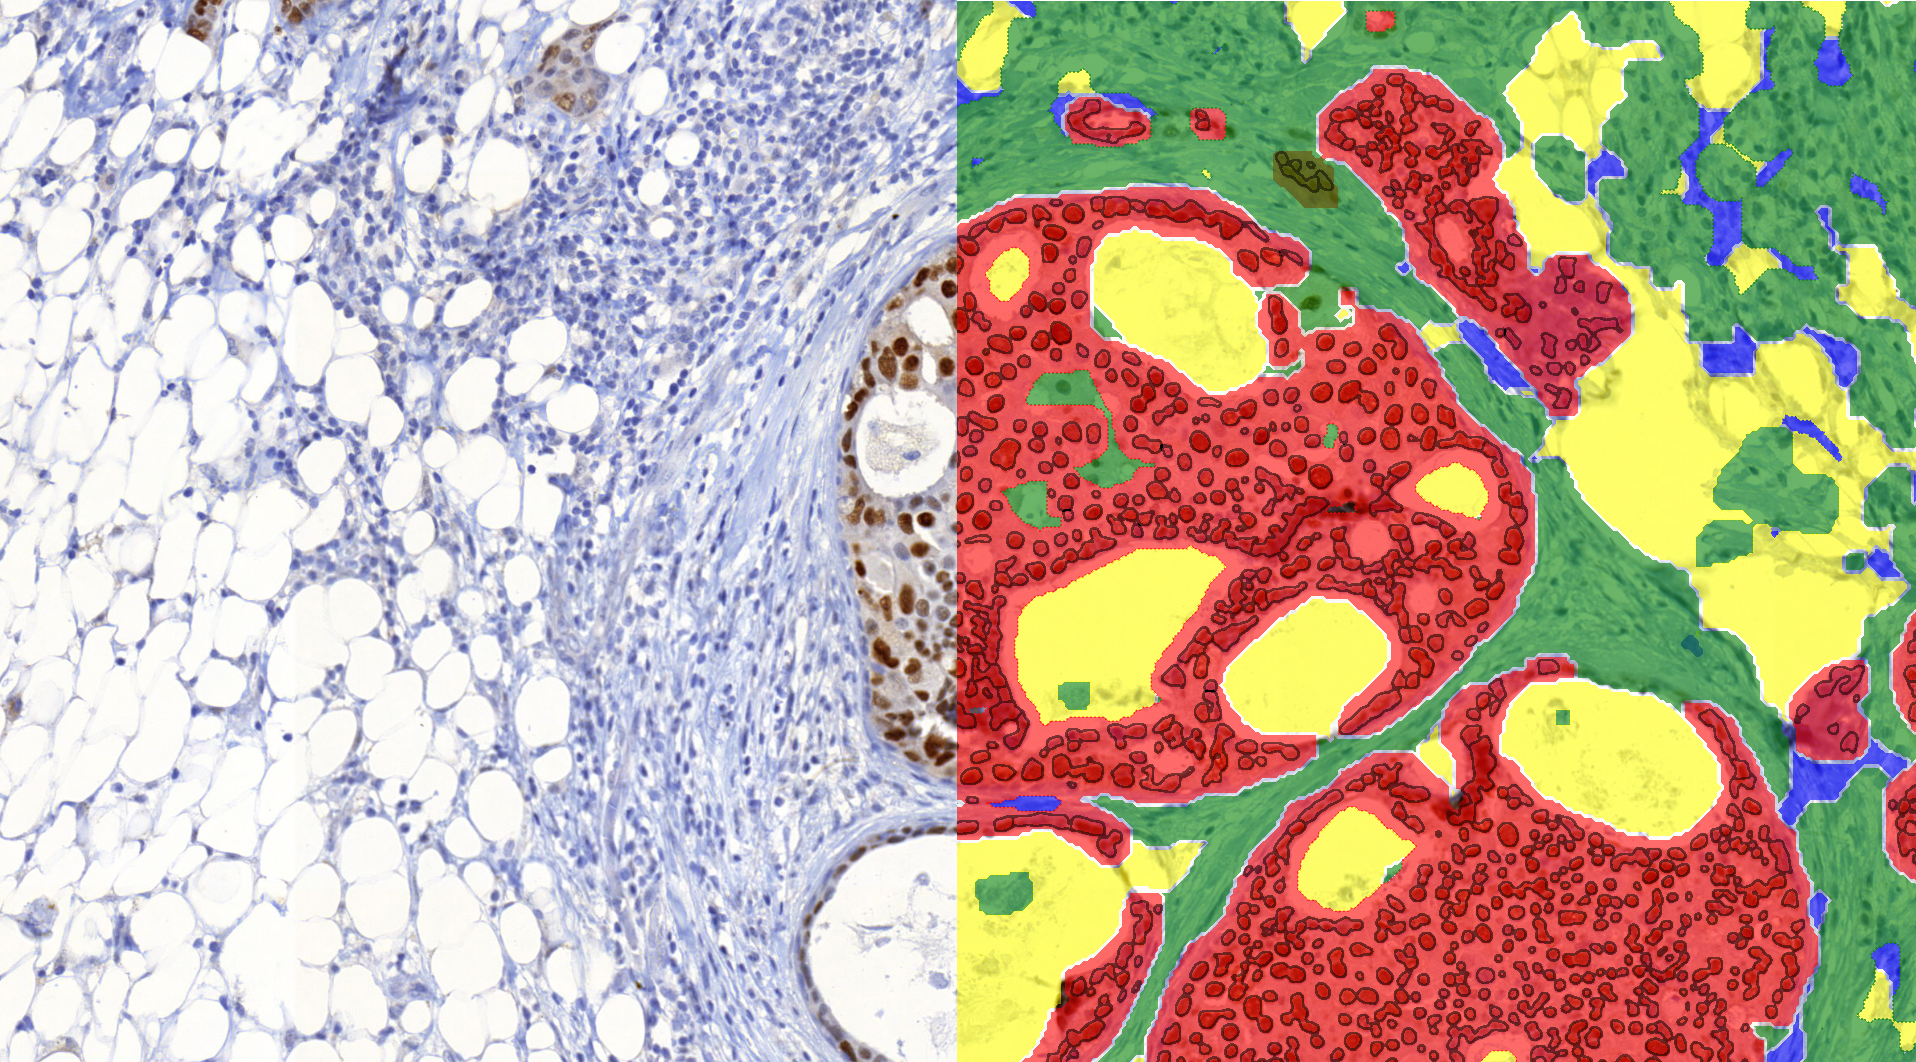
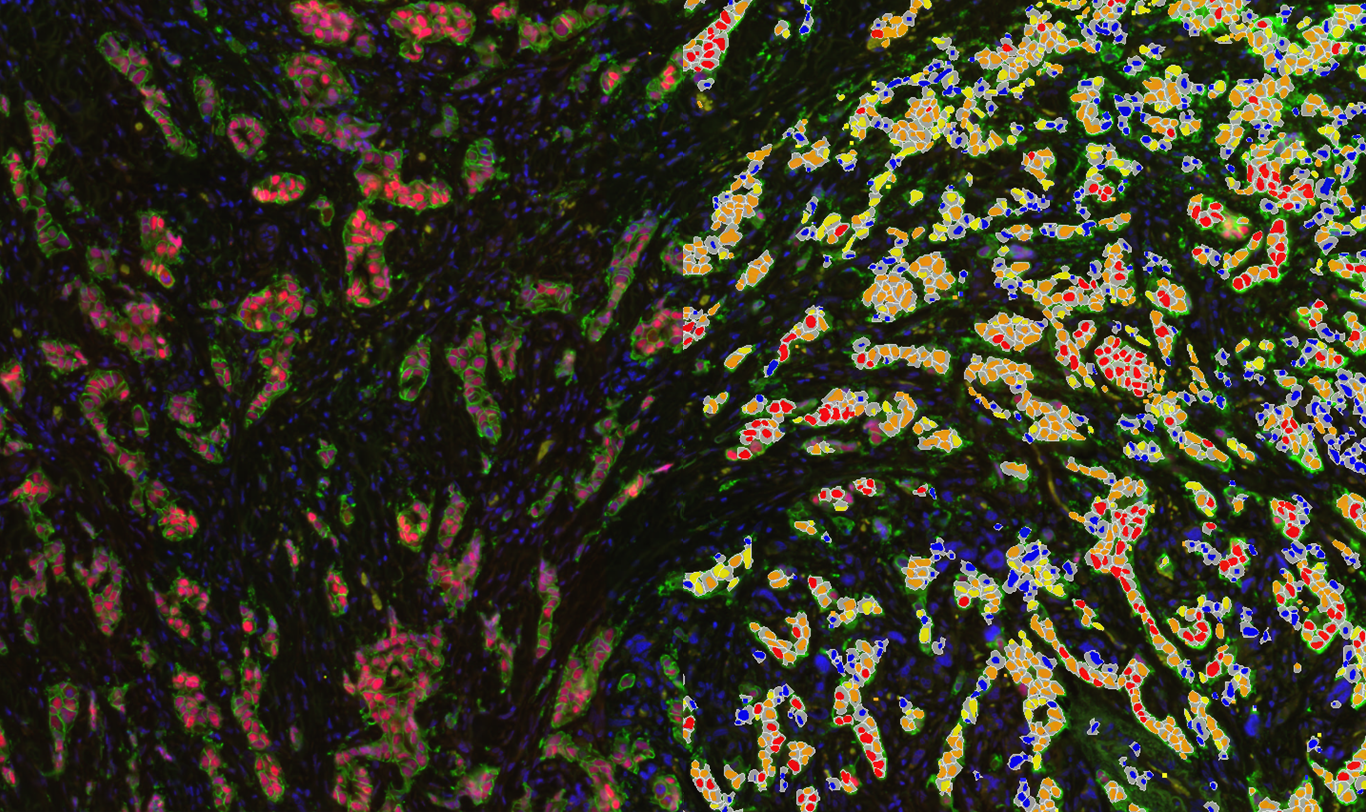
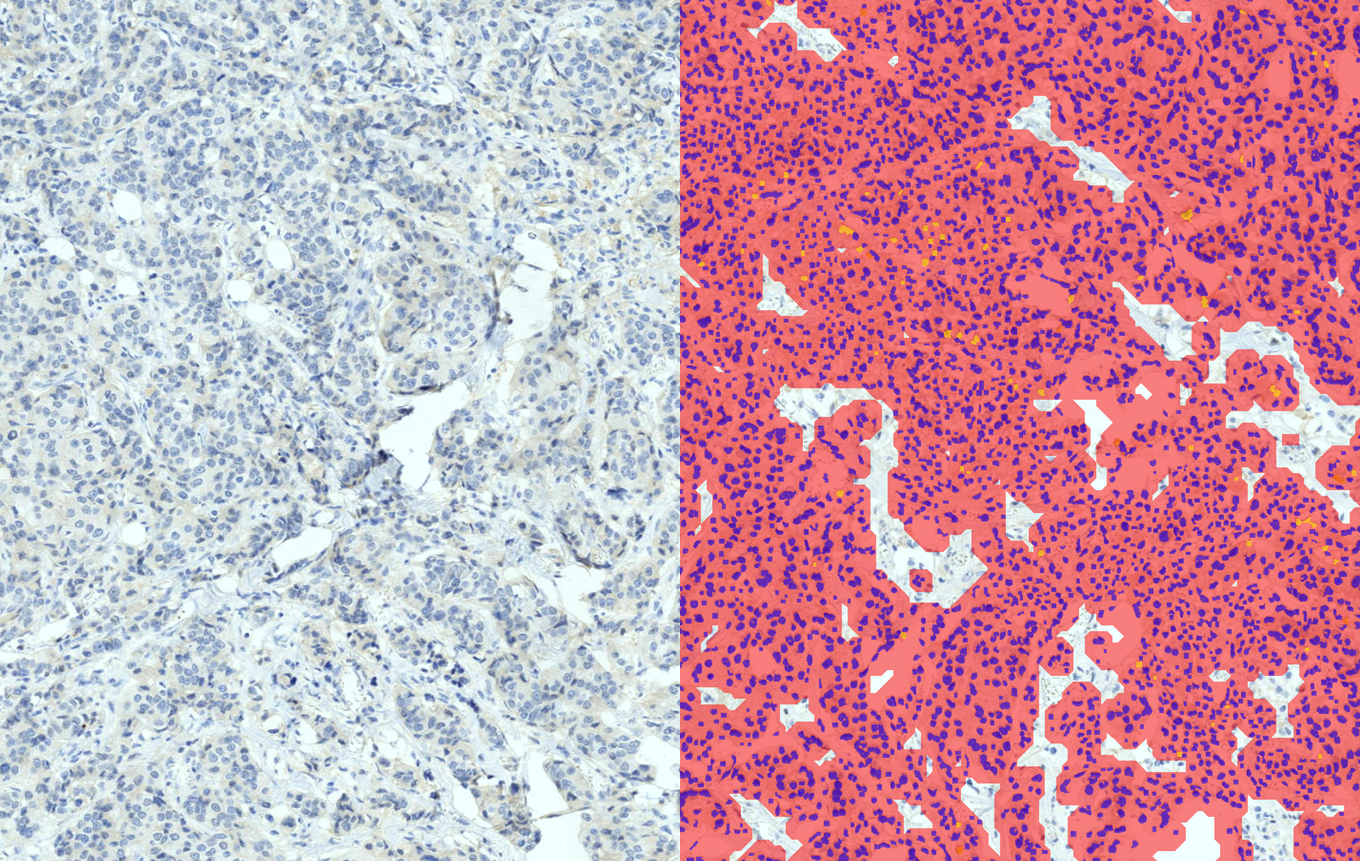
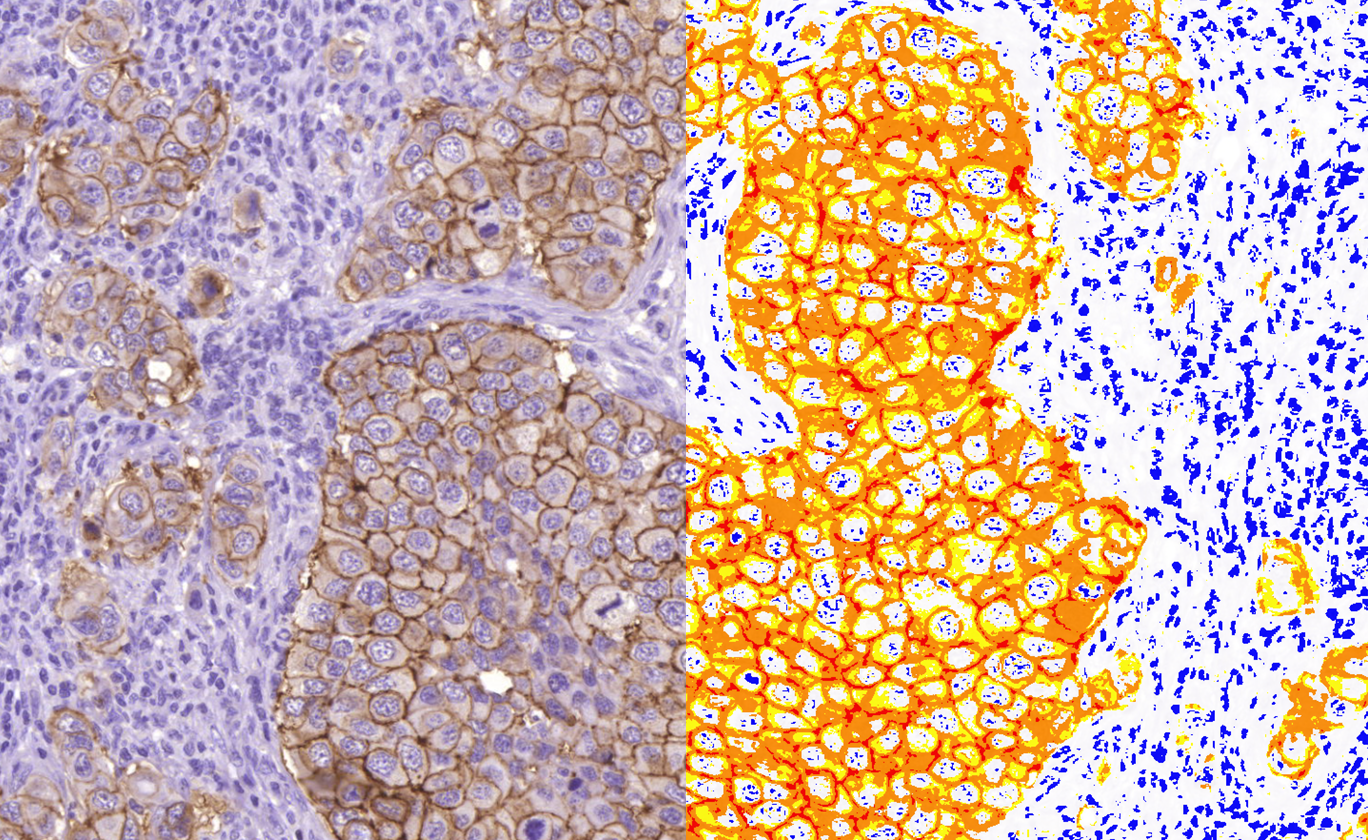
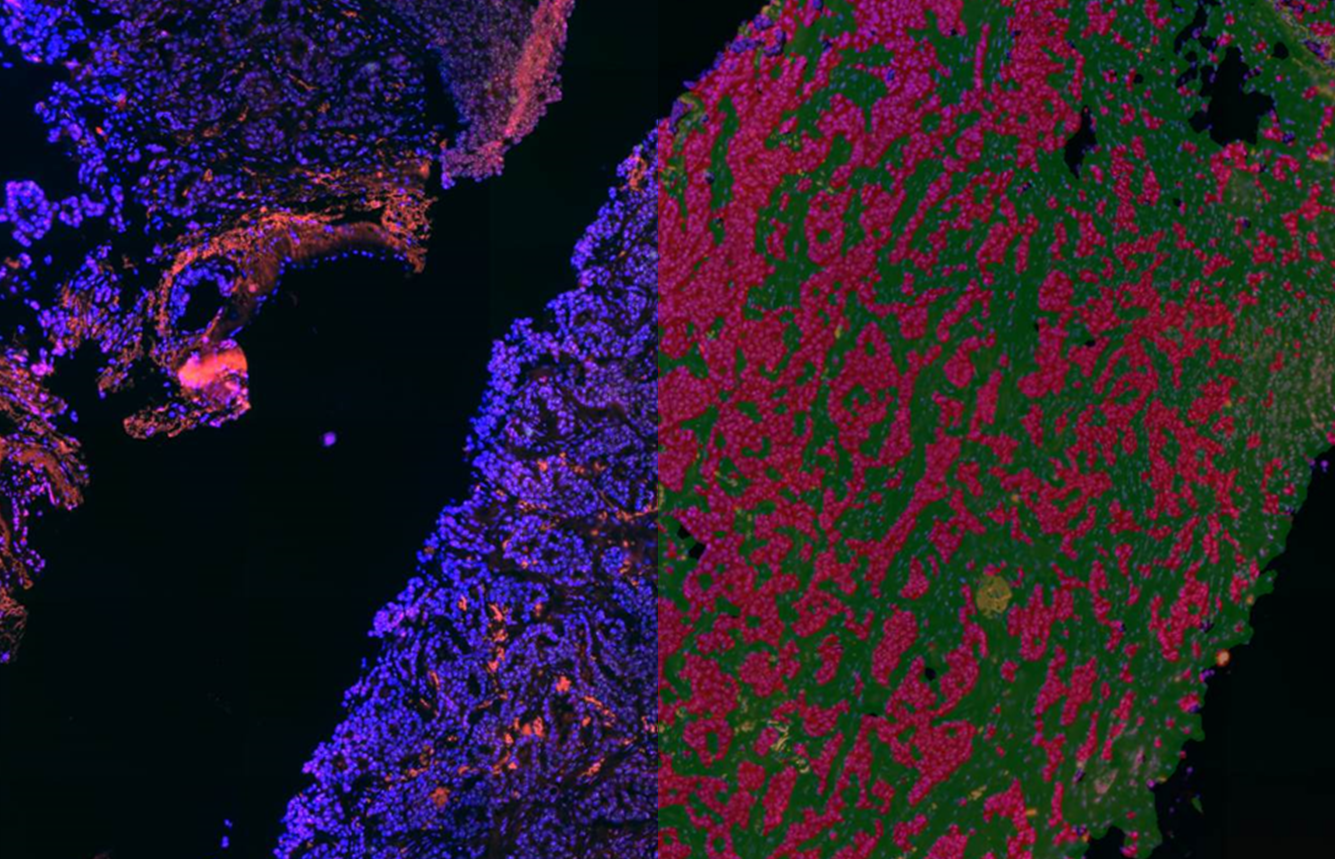
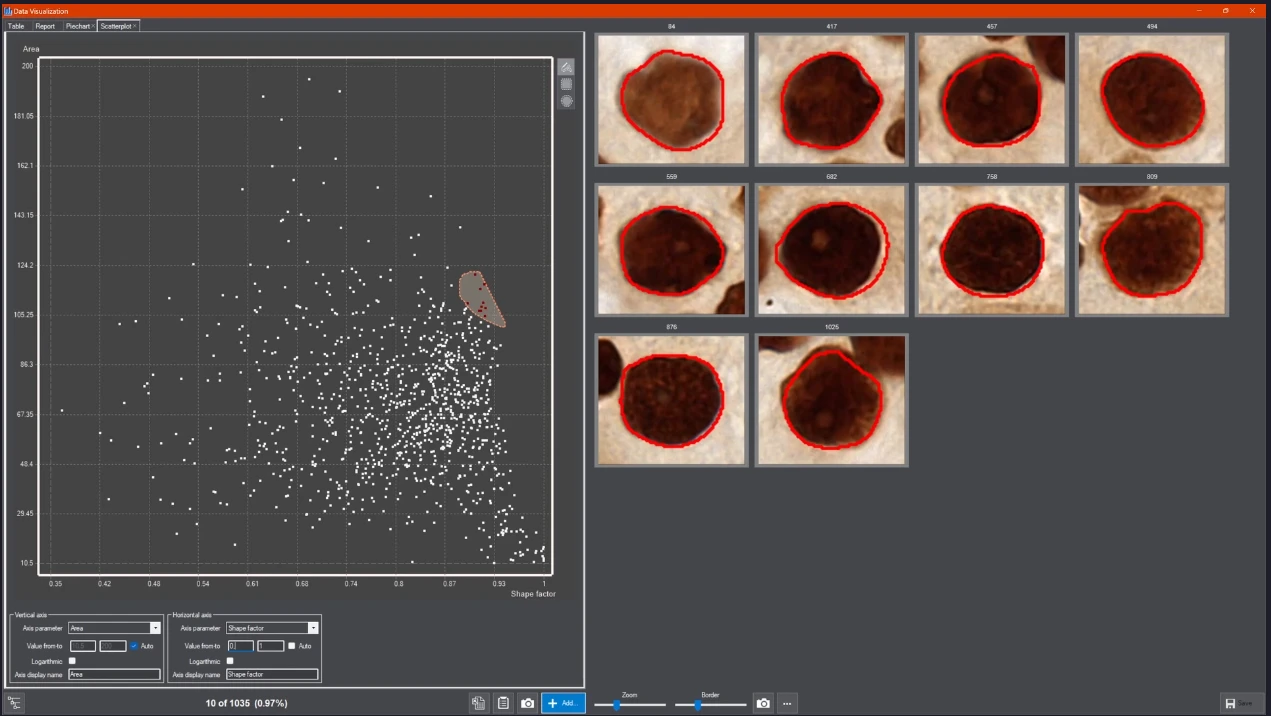
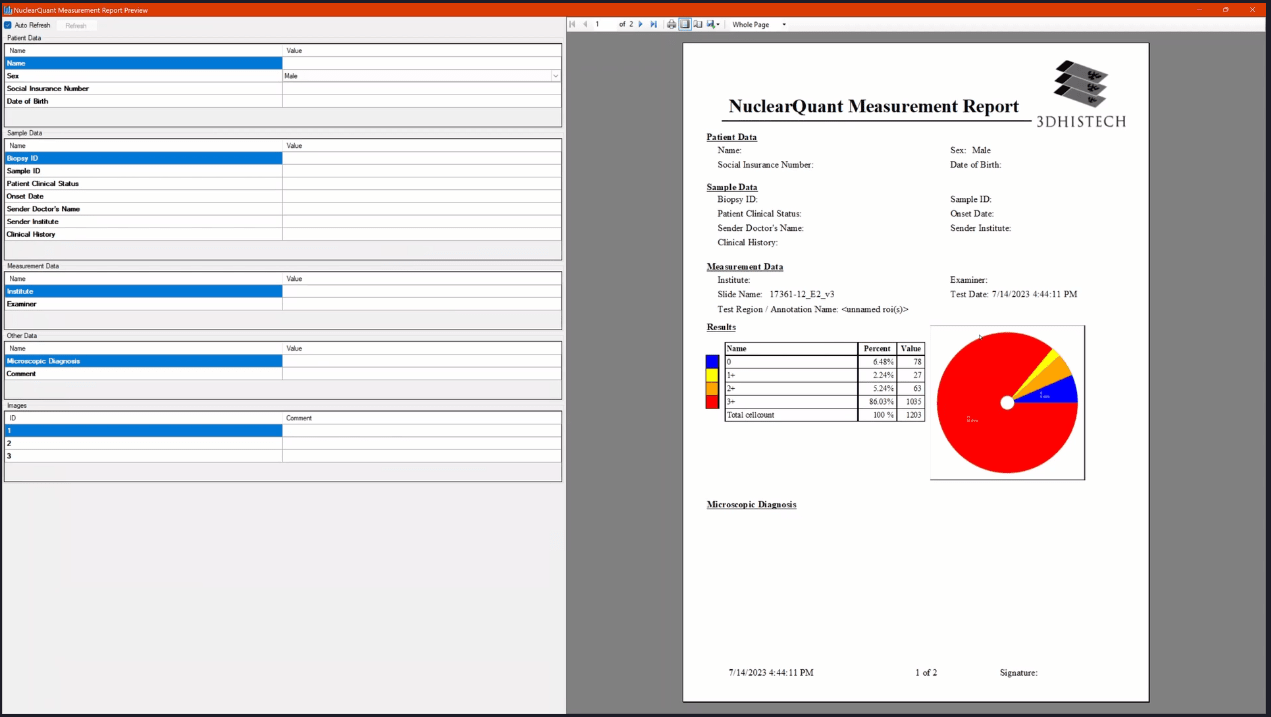
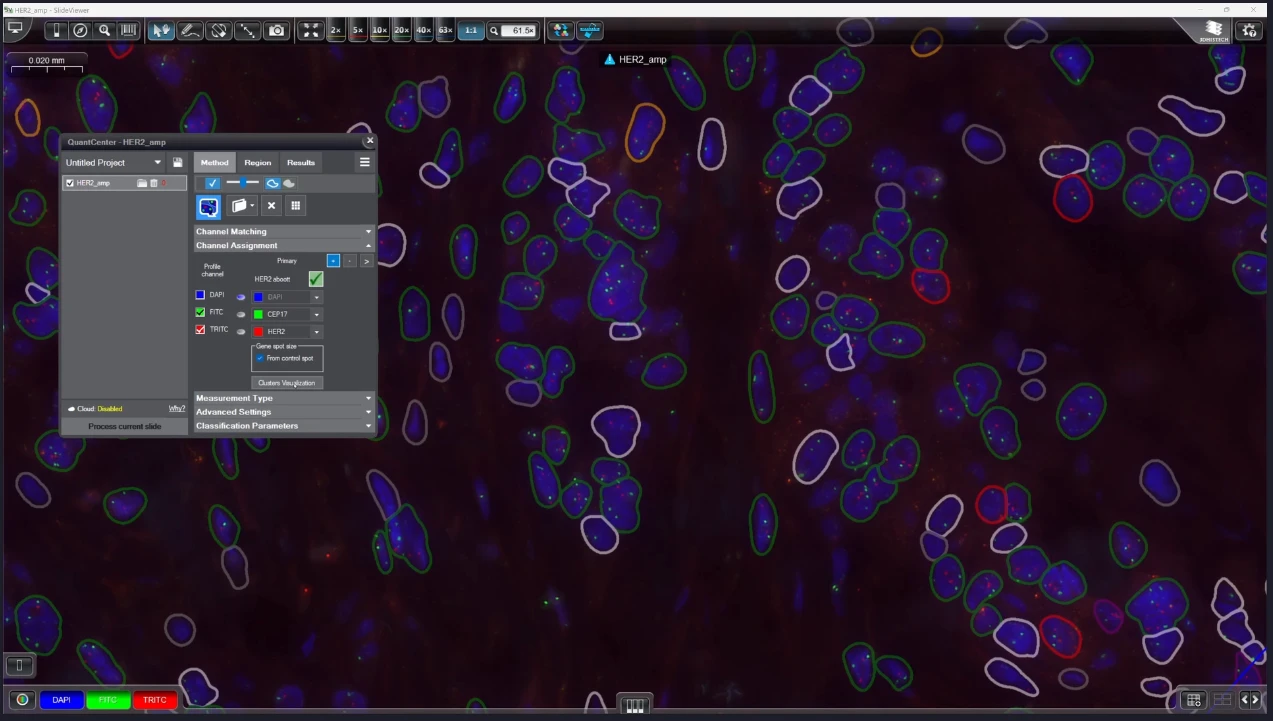
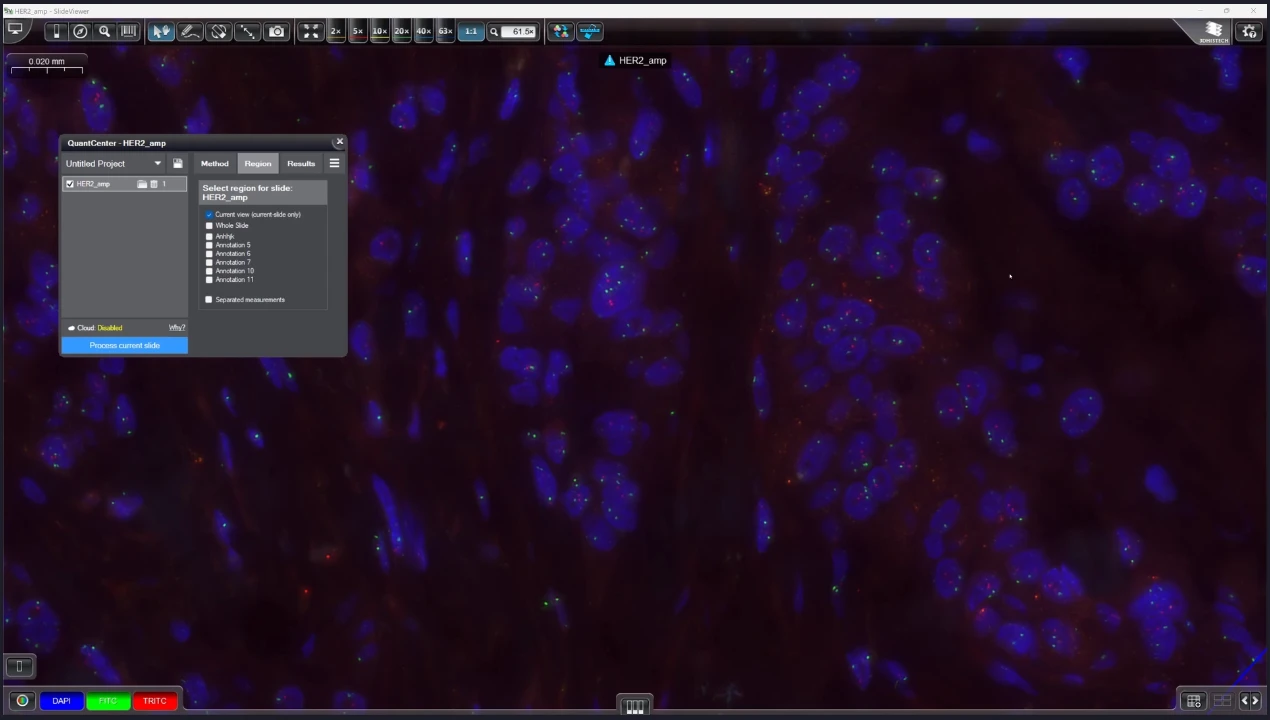
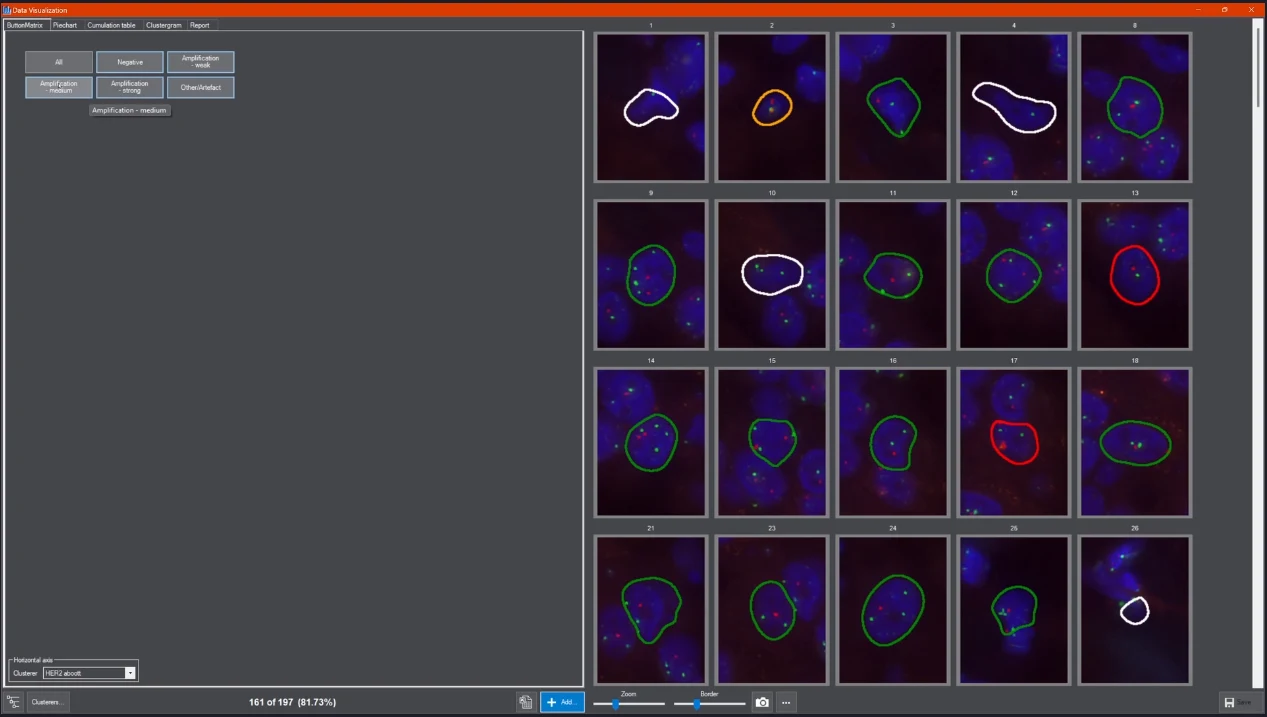
Targeted quantification with NuclearQuant, MembraneQuant, CellQuant, DensitoQuant, FISHQuant, and CISHQuant, covering all major staining techniques.
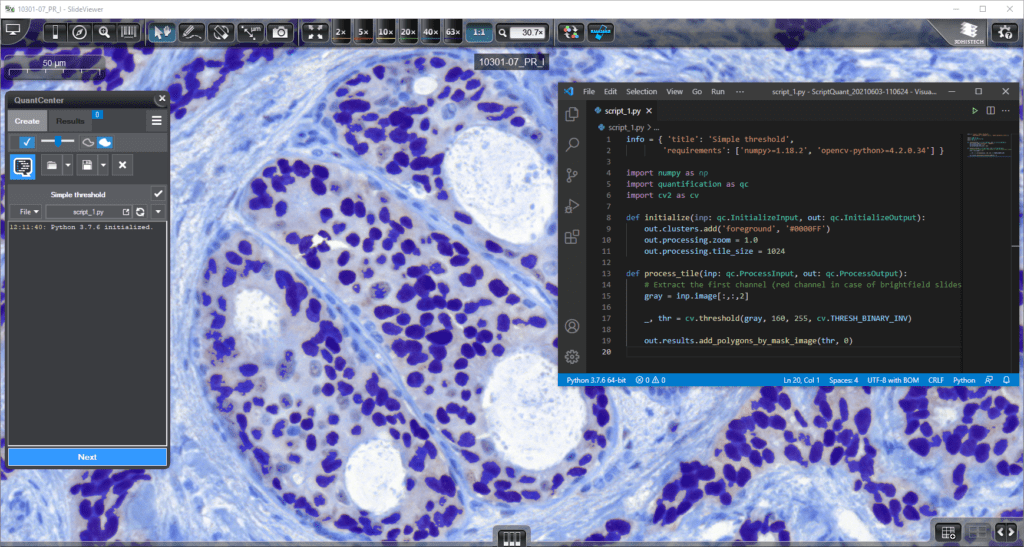
Custom script integration via ScriptQuant, offering unmatched flexibility in digital pathology.